We’ve received a few inquiries recently from clients asking whether we would recommend adding cash to portfolios given the market’s strength over the last 18 months. Asked differently, should we approach the markets with caution given that we are at all-time highs (ATHs)? We’re eager to address this question in this month’s PAC Insights.
To quickly debunk this theory, history tells us, no, we should not. Let’s dive in.
Looking at S&P 500 price returns since 1927, the market has experienced a total of 1,397 all-time highs. The average length between all-time highs is roughly 17 trading days! ATHs are common as dirt.
While that data tells us not to fear adding to equity investment at all time-highs (ATH), context matters. Recently we came across a research piece from a Wall Street firm that showed the average 1-year return of the S&P 500 from ATHs is 9.3% vs. 9.0% for the average of all 1-year forward returns.
We produced our own customized model that told a positive, but different story:
| Source | 1YR All | 1YR ATH | 3YR All | 3YR ATH |
| Wall Street Firm | 9.0 | 9.3 | 8.0 | 8.6 |
| PAC | 7.8 | 7.8 | 6.5 | 5.4 |
Source: Goldman Sachs, Bloomberg and Park Avenue Capital
How could the data be so different?
It took us a while, but we identified the distortion…the starting date. Our investment team referenced the full history of the S&P 500 dating back to 1927, while the other study, which did not disclose the start date, appears to have started in 1970.
If we had an agenda to support how investing at ATHs is beneficial, we would use 1990 as a starting date. Using this start date would illustrate more compelling forward returns than the other firm’s study. In this case, we think it is most appropriate to include the entirety of the index information going back to 1927.
While we do not see a fault with the other study, the differences illustrate that nuances do matter. In addition to the above study, our team identified another particularly important nuance at the beginning of this year - the duration of time between ATHs.
ATHs After Lengthy Draw Downs
When the S&P 500 reached an ATH on January 19th, 2024, two years after the previous ATH, our investment team communicated to our organization:
The path ahead after the market spends at least one year recovering ATHs is very favorable. The S&P 500 hit an all-time-high (ATH) on Friday’s close, after 512 trading days- or just over 2 years- since the last ATH. Going back to 1927, when the S&P 500 takes at least one year to recover its ATH, there have been fourteen occurrences. The average forward one-year return when the market regains ATH is 14.06%, with 93% of occurrences having a return greater than 0%. Going back to 1927, the average forward return over all periods is 7.85% with 69% positive outcomes. We can conclude that unless we are in a sustained period of higher inflation or other yet unrecognized economic challenges, the path one-year ahead has support for positive outcomes.
The 2022 bear market marked only the seventh time since 1927 that we went more than two years without an ATH. This is amazing given the index is up 23% from the ATH reached before this period! In fact, the 2022 bear market was particularly lengthy given that we did not have a recession.
As noted in our reference above, the path ahead after the market spends at least one year recovering ATHs is very favorable. Since the ATH was regained in January, the index is up 17.9% (as of 7/16/24), ahead of the 1-Year average return of 14.06% (referenced above).
Bottom line. An ATH is NOT a reason to be cautious of the markets. Historically, forward returns from ATHs are around average to above average. By remaining invested in your financial plan, our clients’ portfolios have benefited from the historically aggressive nature of returns when the stock markets reclaim ATHs for a sustained period.
Corrections
While we never know when the next correction will materialize, we do know that the average intra-year decline of the S&P 500 since 1980 is 14.1%. Despite these healthy and frequent corrections, the S&P 500 has returned a compounded 10.3% over this time. A large intra-year drawdown does not necessarily mean a down year, in fact there have only been ten negative years over this period. This just means at some point during the year, on average, the market experiences a drop of 14% from a higher level. Some years less, other years more.
In 2023 we experienced a 10.3% intra-year decline during a year in which the index returned 26.3%, including price and dividends. Does that mean we are due for a greater than 14% intra-year drawdown this year? No. But if one materializes, it should not be a surprise.
S&P 500 ANNUAL RETURNS AND DRAWDOWNS
Despite the S&P 500 declining on average 14.1% intra-year, the stock market has experienced positive returns in 35 of 46 years.
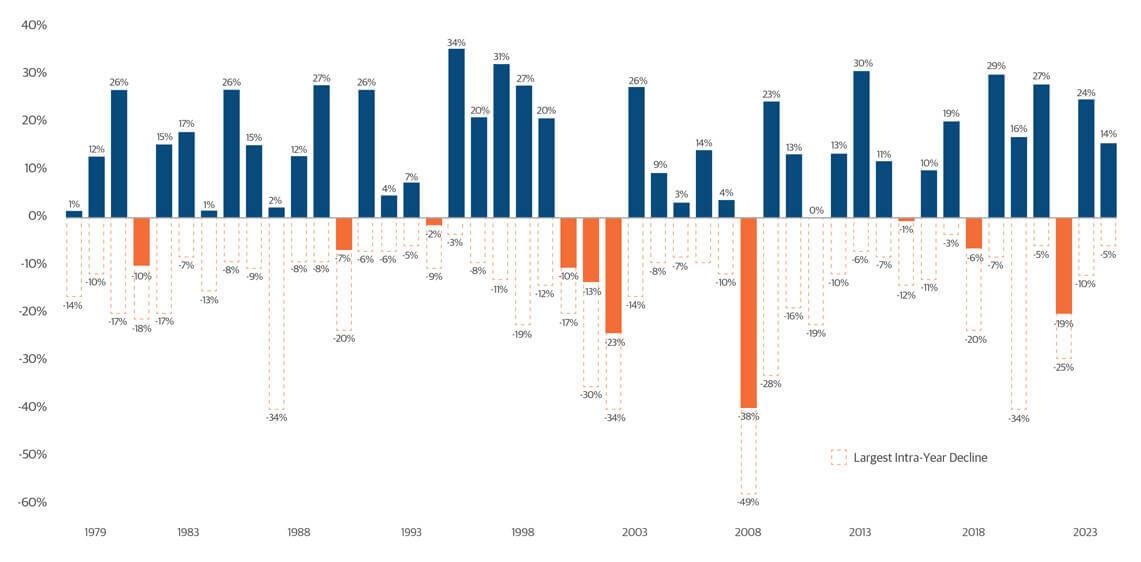
S&P 500 returns do not take into account the reinvestment of dividends. All data is from Morningstar Direct through 6/30/2024. Intra-year decline is defined as the largest peak to trough decline during the calendar year. The chart is for illustrative purposes only and not intended as a recommendation. Past performance is not a guarantee of future results. All investments carry risk, including potential loss of principal, and no investment strategy can guarantee a profit or completely protect against loss. Indexes are unmanaged and cannot be invested in directly. Northwestern Mutual is the marketing name for The Northwestern Mutual Life Insurance Company, Milwaukee, WI (NM) and its subsidiaries. Investment brokerage services are offered through Northwestern Mutual Investment Services, LLC (NMIS) a subsidiary of NM, broker-dealer, registered investment adviser, and member FINRA and SIPC. Investment advisory and trust services are offered through Northwestern Mutual Wealth Management Company® (NMWMC), Milwaukee, WI, a subsidiary of NM and a federal savings bank. Products and services referenced are offered and sold only by appropriately appointed and licensed entities and financial advisors and professionals. Not all products and services are available in all states. Not all Northwestern Mutual representatives are advisors. Only those representatives with “Advisor” in their title or who otherwise disclose their status as an advisor of NMWMC are credentialed as NMWMC representatives to provide investment advisory services.
When the next correction comes, we should be prepared for the most dangerous part… the media onslaught. One favorite tactic among the media and self-promoting pundits is to compare any ongoing correction to the worst historical bear markets. It makes for great copy and clicks.
The long-term premium return on equity investments can only be realized by living through this relentless market volatility. The pink line in the drawdown chart above illustrates how the stock market generates average returns. Averages are the accumulation of many widely varying individual years, including extreme outliers on both sides. An “average” year in the stock market is rare, but the long-term averages over history are exceptionally close. Long-term average market returns are generated because of, not despite, extreme variations.
The next chart shows the media count for “GFC” (Great Financial Crisis) stories since 2015. The media used the Covid market sell-off to go on the offensive with a dire comparison to the 2008 recession. Of course, Covid had absolutely nothing to do with 2008. The whole point was to engage emotionally by harkening back to a tumultuous time that all readers would vividly recall. Because technology stocks have outperformed during the recovery from 2022, the media will certainly draw comparisons to the 2000-2002 Technology Bubble collapse. It is worth remembering, but one has nothing to do with the other.
News Trends "Great Financial Crisis"
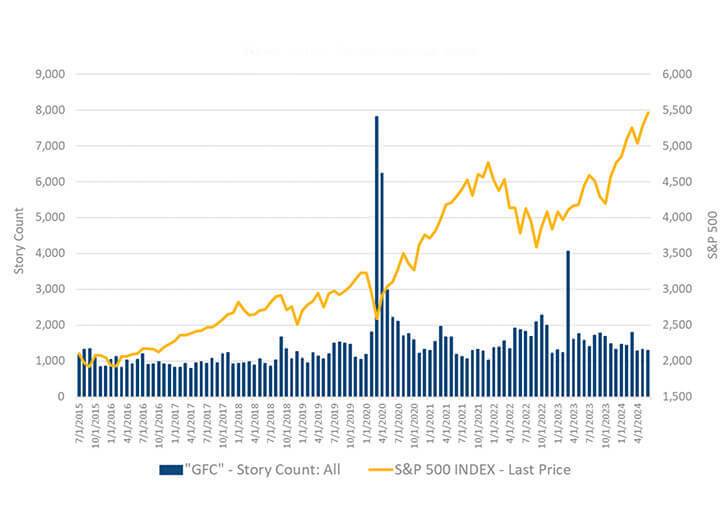
Source: Bloomberg
Opportunity and Implementation Alpha
Near weekly, we see the recycled articles on overstretched valuations, market pullbacks, concentration and more, from people who knowingly or unknowingly promote market timing.
Market corrections provide opportunity. While we are not immune from feeling anxiety during sharp market declines, we do get excited for the opportunity to actively manage taxes and streamline portfolios that came to PAC with legacy positions burdened with unrealized gains. The best plan during corrections, drawdowns, and bear markets has always been rebalancing and patience. Let the plan work.
Choppy markets are terrific for asset accumulators.
In short, market corrections offer the opportunity to 1) acquire the economic benefit of realized losses, 2) put new money to work at lower prices, 3) opportunistically rebalance and 4) expedite portfolio transitions.
Many advisory teams tax-loss sell situationally, for example, at year end. PAC's operations team tax-loss sells opportunistically regularly each year. Tax-loss selling over the last four years has covered a sizable portion of our non-qualified account advisory fees in client accounts where that opportunity has been available.
For clients in distribution mode, we have a model that alerts us to statistically significant corrections. Under these situations cash reserve is used to source distributions, allowing us to rebalance from bonds to stocks at lower equity prices.
To wrap up: Market pullbacks and market corrections are necessary for the health of the market and often afford a compelling opportunity. The plan is the ultimate guide through the wide variation in market outcomes on both sides of the ledger.
The opinions expressed are those of Park Avenue Capital as of the date stated on this communication and are subject to change. There is no guarantee that any forecasts made will come to pass. This material does not constitute investment advice and is not intended as an endorsement of any specific investment or security. Please remember that all investments carry some level of risk, including the potential loss of principal invested. Indexes and/or benchmarks are unmanaged and cannot be invested in directly. Returns represent past performance, are not a guarantee of future performance and are not indicative of any specific investment. Diversification and strategic asset allocation do not assure profit or protect against loss.